

Bitcoin was down 5.3% for October as of the 29th's close, with two days of trading left, and the market is about to log its second straight red "Uptober." The usual reading is that a failed seasonal rally is a warning sign. The monthly return table behind the meme tells a different and more useful story: the calendar has almost nothing to say about what happens next, and the things that do have something to say are sitting in plain view.
The Uptober Average Is Built on Three Years
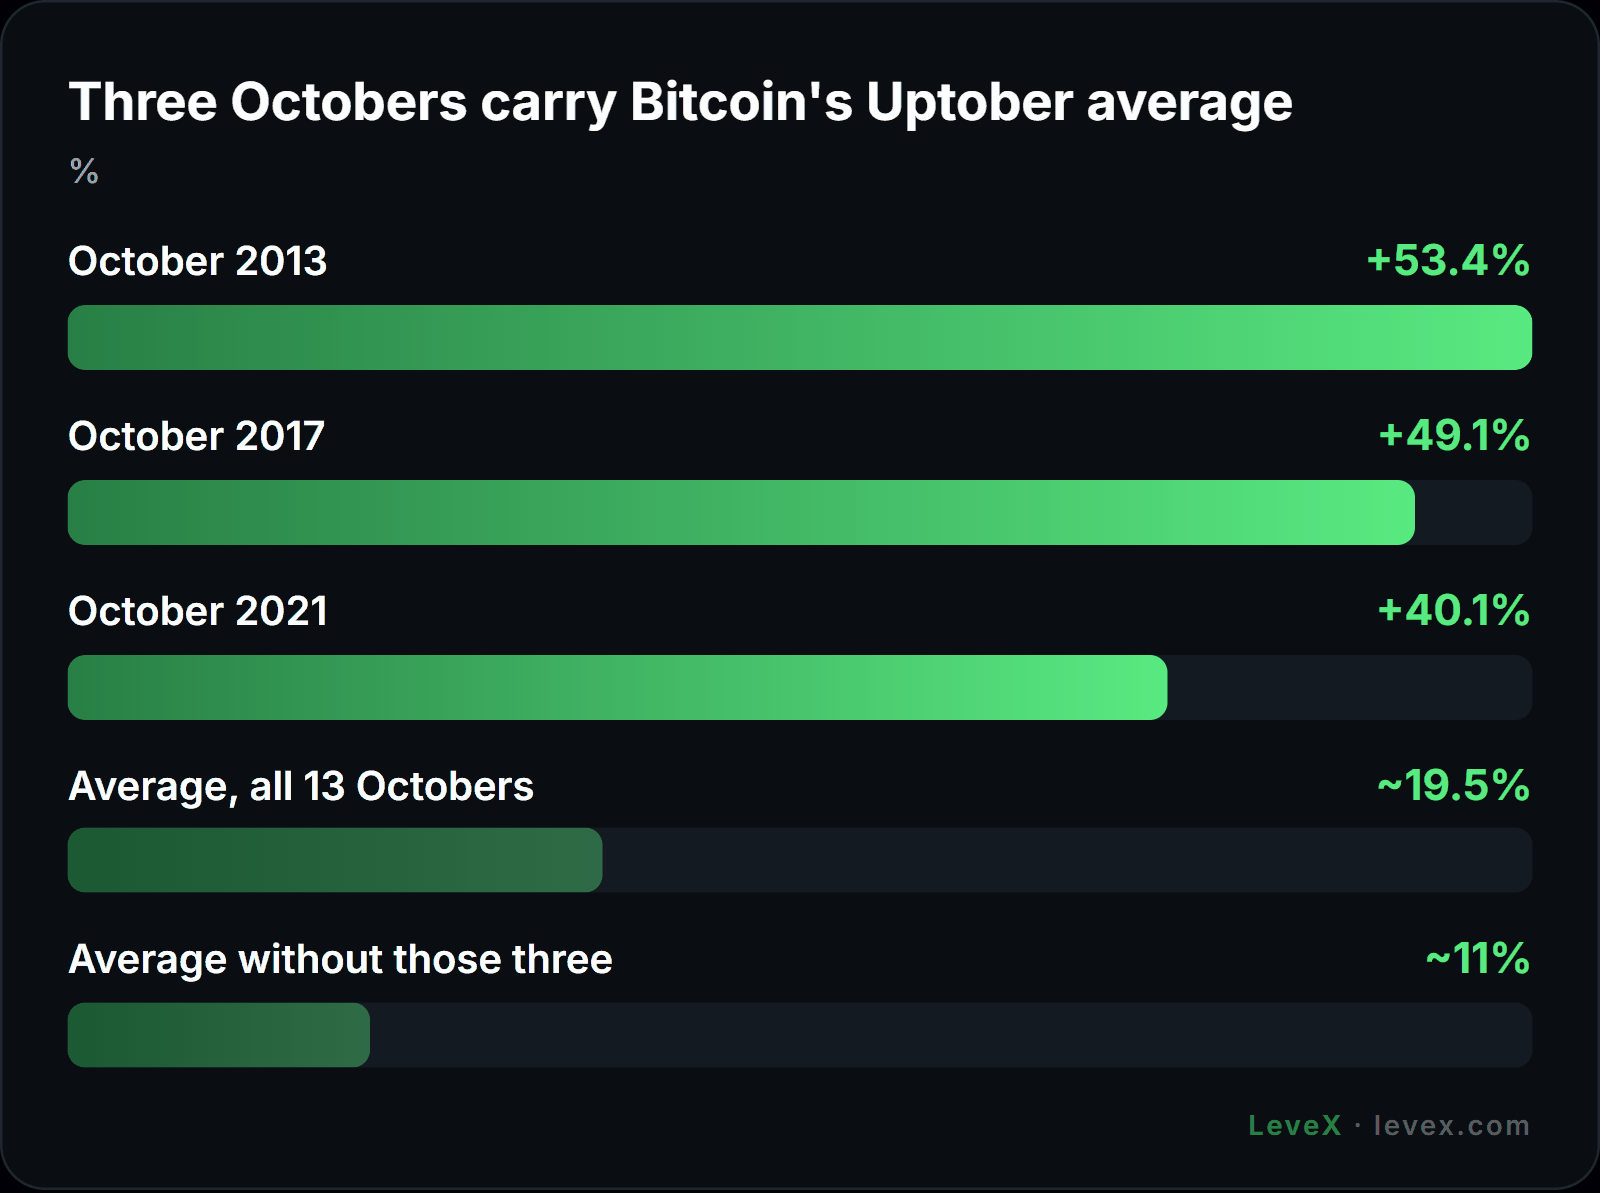
October's reputation is real on paper. Using Coinfuty's monthly return table, Bitcoin averaged roughly 19.5% in Octobers from 2013 through 2025, and closed green in 10 of those 13 years. Then you look at where the average comes from. Three months, October 2013 (+53.4%), October 2017 (+49.1%) and October 2021 (+40.1%), do most of the lifting, and all three landed in the hottest stretch of a bull cycle. Remove them and the other ten Octobers average about 11%, which is a nice month and roughly what a strong market produces in any month.
November is where the seasonal story gets almost comical. Its average across the same years is around 42%, which sounds like a reason to hold through Thanksgiving until you notice that November 2013 returned about 454% on its own. The median November is 8.8%. More recently the month has been unkind:
| Year | October | November |
|---|---|---|
| 2018 | -4.6% | -36.4% |
| 2019 | +10.4% | -17.6% |
| 2020 | +27.9% | +43.1% |
| 2021 | +40.1% | -7.1% |
| 2022 | +5.5% | -16.3% |
| 2023 | +28.6% | +8.8% |
| 2024 | +11.1% | +37.2% |
| 2025 | -3.9% | -17.6% |
November closed red in five of the last eight years. Green Octobers were followed by red Novembers three times, red Octobers by a red November twice, and the one red October before that, in 2014 (-12.6%), was followed by a +11.7% November. With samples this small, a trader can find a pattern to support almost any view, which is the strongest argument for using none of them.
What Actually Moved Bitcoin This Month
Context also matters more than the label on the month. Bitcoin's third quarter closed up about 42.6%, with August alone adding 25%. A 5% giveback after that run reads more like digestion than a broken trend, even if 2026 as a whole is still down roughly 9.7% year to date.
The month's real drivers had nothing to do with the calendar:
- The Fed. Bitcoin slipped under $80,000 after the Federal Reserve held rates on October 28 with a hawkish tone, as FXStreet reported, and roughly $340 million of mostly long positions were liquidated around the move.
- Spot demand. AMBCrypto, citing CryptoQuant, found spot demand contracting through the month and U.S. Bitcoin ETFs about $26 million net negative for October, a sharp contrast with the inflow streaks that powered earlier rallies.
- Positioning. CryptoQuant's Bull Score Index fell from 90 to 60, a cooling that still sits short of outright bearish territory.
Every one of those can flip inside a single week. None of them checks the date first.
The LeveX Take
The useful lesson from a red October is about timing, and it cuts against both camps. Seasonal bulls were wrong about the month, and the people now extrapolating a red November are leaning on the same thin sample in reverse. What remains true is that the drivers listed above are unscheduled in the way that matters most: ETF flows turn without notice and the next macro surprise has no date on it. A trader can hold a reasonable directional view on BTC and still have no idea whether the next 10% comes before or after the next 8% drawdown, and that second uncertainty is what usually ends positions.
That is the problem Futures Credit is designed around. Credit earned through LeveX Quests pairs with real margin, absorbs losses up to its own value while profits stay with the trader, and covers up to half of trading and funding fees. For a position built on flows and macro and deliberately agnostic about the calendar, the fee coverage does quiet but meaningful work, because a view that needs three or four weeks to resolve pays funding the whole time it waits. A buffer against an early wick buys patience. It does not make a wrong thesis right, and sizing still has to assume the credit runs out.
Watch the Flows Before the Calendar
Anyone who held through the red October of 2018 remembers how calm that month felt, and how the damage arrived in November, when the Bitcoin Cash hash war and capitulating miners dragged the price toward $4,000. The four-year cycle debate has the same weakness as Uptober: a handful of data points asked to carry a lot of conviction. Watch the ETF flow prints and the next Fed communication, and treat the month's name as trivia.
BTC trades on LeveX spot and on perpetual futures with up to 500x leverage, and Crypto in a Minute covers funding, liquidations and market cycles in short reads.